 Jill Eisenberg, our Resident Literacy Expert, began her career teaching English as a Foreign Language to second through sixth graders in Yilan, Taiwan as a Fulbright Fellow. She went on to become a literacy teacher for third grade in San Jose, CA as a Teach for America corps member. She is certified in Project Glad instruction to promote English language acquisition and academic achievement. In her column she offers teaching and literacy tips for educators.
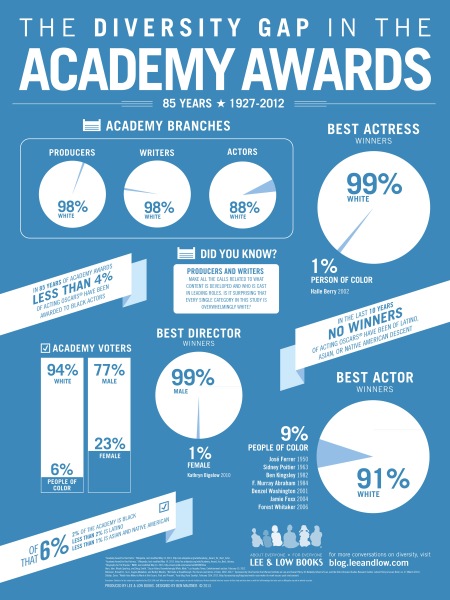
Infographics’ format and economy of words make infographics engaging and accessible to children, reluctant readers, visual learners, and English Language Learners. As infographics contain multiple layers of information, they are a challenging medium for students to practice inferences and interpretation. Lee & Low Books’ infographic series on the diversity gap in major spheres of influence is a valuable vehicle to build students’ visual literacy skills and understanding of diversity. The following discussion questions and suggested activities were created based on the Diversity Gap in the Academy Awards infographic, but these can be applied to the rest of the series.
Discussion questions to consider with your students:
- What patterns do you see? What trends do you see? How are the different charts related?
- What is the central idea of this infographic? How do the words, phrases, and visuals interact to affirm the central idea?
- Based on the infographic, what does “diversity gap” mean in terms of the Academy Awards?
- What might the author’s purpose be in choosing this medium to convey the central idea (to shame, inspire, shock, etc.)?
- Does the infographic make the central idea clear and obvious? How does the infographic use an economy of words, language, typography, pie charts, bar graphs, negative space, and title to communicate the central idea?
- What type of infographic is this (flow chart, web, map, graph, diagram, table, timeline)? What might the author’s purpose be in choosing this type of infographic? How effective is this format of infographic at organizing and displaying data compared to just text?
- Evaluate the effectiveness of the infographic as a form of communication as compared to text alone. Is this the most effective and convincing way to convey information about a lack of diversity at the Academy Awards? Why or why not?
- Why might the creators have assembled this information about the Academy Awards and race at all?
- Who is the intended audience (moviegoers, actors, directors, writers, producers, movie studios, general public, government officials)? What might the creators of this infographic want them to do with this information?
- What is the context of this infographic? What major events in the United States were taking place when this infographic was created? Why is it important to understand the context of the infographic?
- Is this infographic’s argument and presentation persuasive or compelling? Why or why not? Analyze this infographic’s effectiveness in inspiring activism.
- Based on the information presented, what can you predict future trends will be for award winners, actors, directors, producers, and writers?
- Can you determine causes for the lack of diversity in this infographic? Why or why not? How might researchers go about figuring out the cause(s) for the historical and current lack of diversity in the Academy Awards?
- What is the impact of a lack of diversity amongst writers, actors, producers, directors, and award winners? What does it mean to be a young child growing up and consuming this form of media (movies)? What will they see? What will they not see? Tell me more about the possible effects of this situation and current trends.
Suggested activities:
- Challenge students to translate this infographic’s central idea into a written argument. Students should use key details and evidence from the infographic to assert the central idea.
- Have students revise or add on to make the infographic more effective. Students should consider format, adding or deleting information, and more. What would make the infographic stronger, more persuasive, or more memorable?
- Encourage students to investigate how these percentages compare to the general public. Students can use the United States Census data for demographics.
- Have students investigate possible causes for the lack of diversity in the Academy Awards. Urge students to propose ways to change these trends.
- If possible, ask students to research the percent of moviegoers who are people of color. Check industry publications or major news periodicals. How do these numbers compare to the information in the infographic?
- Permit students to interview their grade, class, or school on questions, including: Do you go to the movies? How often? What kinds of movies do you see? Who are your favorite actor and actress in Hollywood today? Who is a director/actor/actress of color that you have seen in a movie recently? Why do you think there aren’t more movies by and with people of color? Students can organize and display data in graphs and present findings to the class. Reflect on this information’s relationship to the infographic’s central idea.
- Dig deeper—investigate the artists that were nominated each year. How many were people of color over those 85 years? What roles did these artists play in the movies they were nominated for? What genres of movies were they in for this nomination? Explore the people of color who did win best actress or best actor. What roles did they play and what kind of movies were they in when they won for best acting?
- Compare this to other Lee & Low Books’ infographics in the series: The Tony Awards, The Emmy Awards, Children’s Book Publishing, The NY Times Top 10 Bestsellers List, and American Politics. Consider central idea, evidence, format, and audience.
- Update the information to include the 2013 and 2014 Academy Awards results. What changed? What did not change?
For further reading on teaching visual literacy and diversity in the classroom, check out these fantastic resources:
- Common Core in Action: 10 Visual Literacy Strategies by Edutopia
- An Approach For Teaching Diversity by Jim Winship
- An Introduction to Information Design by John Emerson and Backspace
- Teaching with Infographics: Places to Start by The NY Times The Learning Network
- Addressing the CCSS with the Use of Infographics by Kathy Schrock’s Kaffeeklatsch
- Standards Introduction by ACRL Visual Literacy Standards
- Classroom Resources from Teaching Tolerance, a Project of the Southern Poverty Law Center
- Visual Literacy Part 1 by School of Teaching and Learning, Ohio State University
- Close Reading + Visual Literacy = Pathways For Understanding
How are you building visual literacy skills in the classroom? Let us know below!


